


juillet 2026 |
||||||
|---|---|---|---|---|---|---|
| lun | mar | mer | jeu | ven | sam | dim |
|
1
|
2
|
3
|
4
|
5
|
||
|
6
|
7
|
8
|
9
|
10
|
11
|
12
|
|
13
|
14
|
15
|
16
|
17
|
18
|
19
|
|
20
|
21
|
22
|
23
|
24
|
25
|
26
|
|
27
|
28
|
29
|
30
|
31
|
||
| DTS | 11 416,8836 |
| USD | 8 565,3457 |
| EUR | 9 295,9692 |
| CNY | 1 203,9332 |
| CAD | 6 191,0677 |
| GBP | 11 154,2268 |
| CHF | 9 910,1518 |
| JPY | 57,3777 |
| DKK | 1 246,3241 |
| NOK | 786,4349 |
| SEK | 813,4735 |
| SAR | 2 290,5694 |
| UCA | 11 416,8836 |
| XOF | 14,1716 |
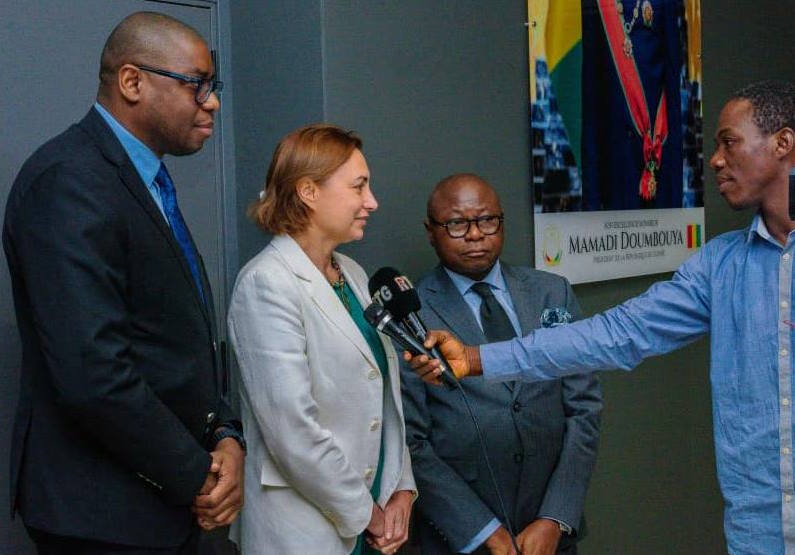
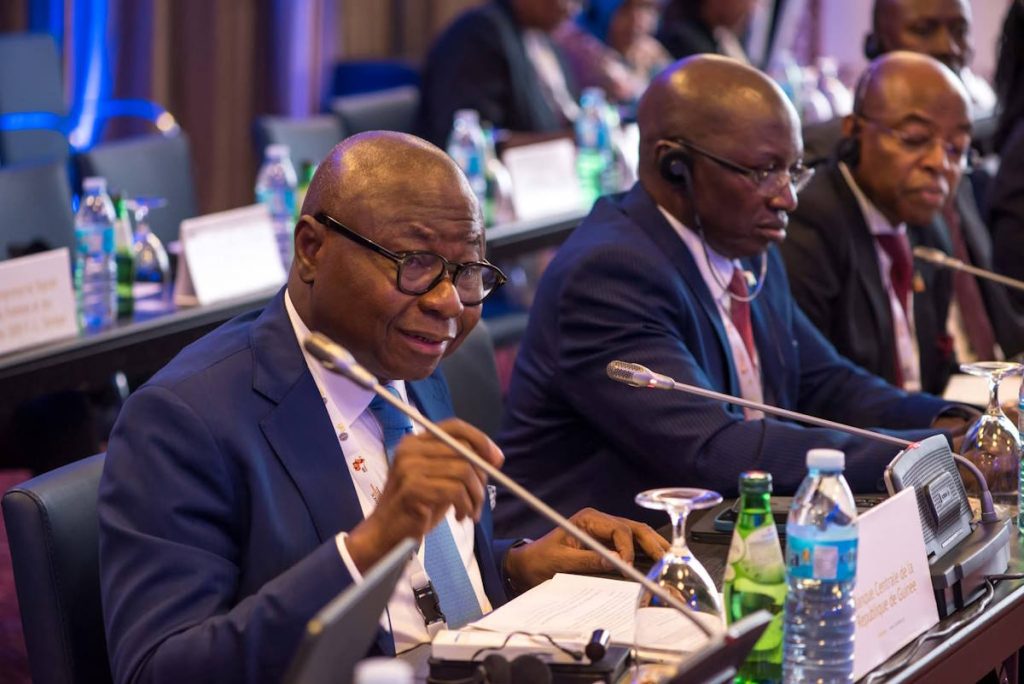
La Banque Centrale de la République de Guinée (BCRG), représentée par son Premier ViceGouverneur, Elhadj Mohamed Lamine CONTÉ, accompagné du Deuxième Vice-Gouverneur, Almamy II SYLLA, et des cadres de l’Institution, a tenu, ce mercredi 17 juin 2026, une réunion stratégique avec la mission du Fonds Monétaire International (FMI), dirigée par Mme Izabela KARPOWICZ
Author: Jacob KOLIE DSI
Author: Moriba KEITA
6 Boulevard du Commerce C/Kaloum
BP 692 – Conakry République de Guinée
Tél: (+224) 664 67 77 77
Fax: (+224) 669 08 88 88
Mail: webmaster@bcrg-guinee.org
6 Boulevard du Commerce C/Kaloum
BP 692 – Conakry République de Guinée
Tél: (+224) 664 67 77 77
Fax: (+224) 669 08 88 88
Mail: webmaster@bcrg-guinee.org
Copyright© 2025 BCRG. Tous Droits Reservés